Snapdragon Profiler
Improving performance of a 3D application is a challenging process. Without the proper tools, developers often find themselves resorting to trial and error to identify a bottleneck or the source of a visual glitch. Each attempt forces an application rebuild. This is a time-consuming and cumbersome process.
Developers rarely have access to a raw list of the graphics API commands that an application issues. This makes the optimization process tricky. The developer is likely to know and understand what their application does in general, but might not have complete visibility into the rendering process.
The reason for poor rendering performance is often unclear at first. Having real-time insight into detailed GPU utilization, texture cache misses, or pipeline stall statistics would make it easier to identify the reason for a slowdown. Sometimes the rendering process consists of many draw calls, making it difficult to identify specifically which of those draw calls is responsible for rendering a broken mesh. The ability to highlight the geometry that was drawn because of any specific draw call is helpful.
The following figures show how the tool works in three different modes, each suiting a different purpose.
Realtime
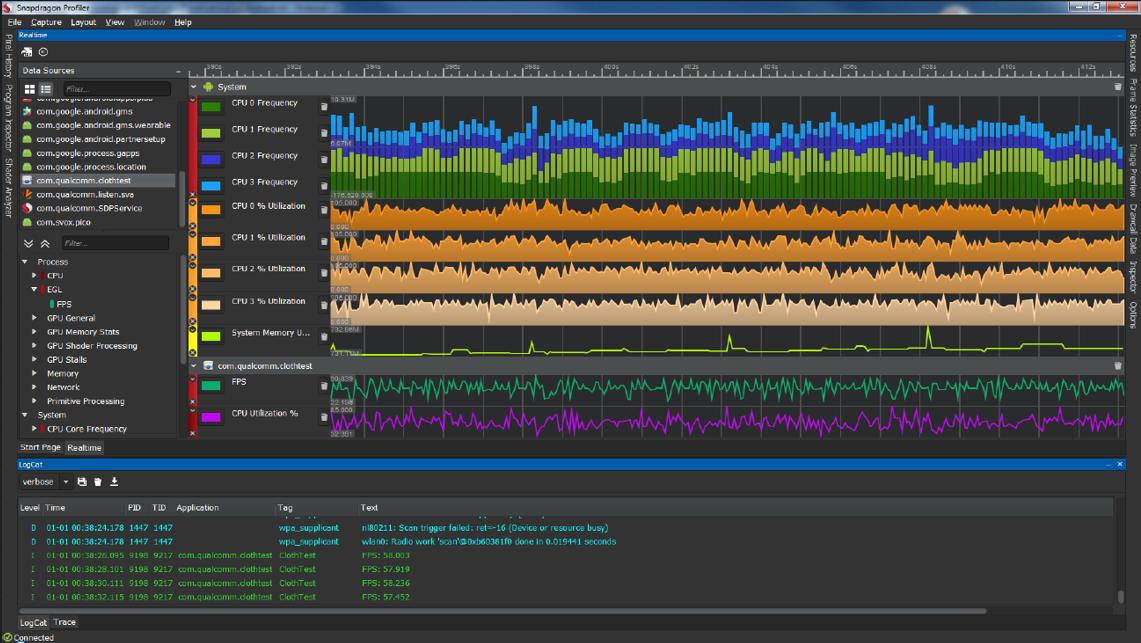
Real-time performance visualization allows for a wide range of both system and per-process metrics and counters to be graphed in real time. Categories of metrics include: * CPU * EGL * GPU * Memory * Network * Power * Primitive processing * System memory * Thermal
Trace
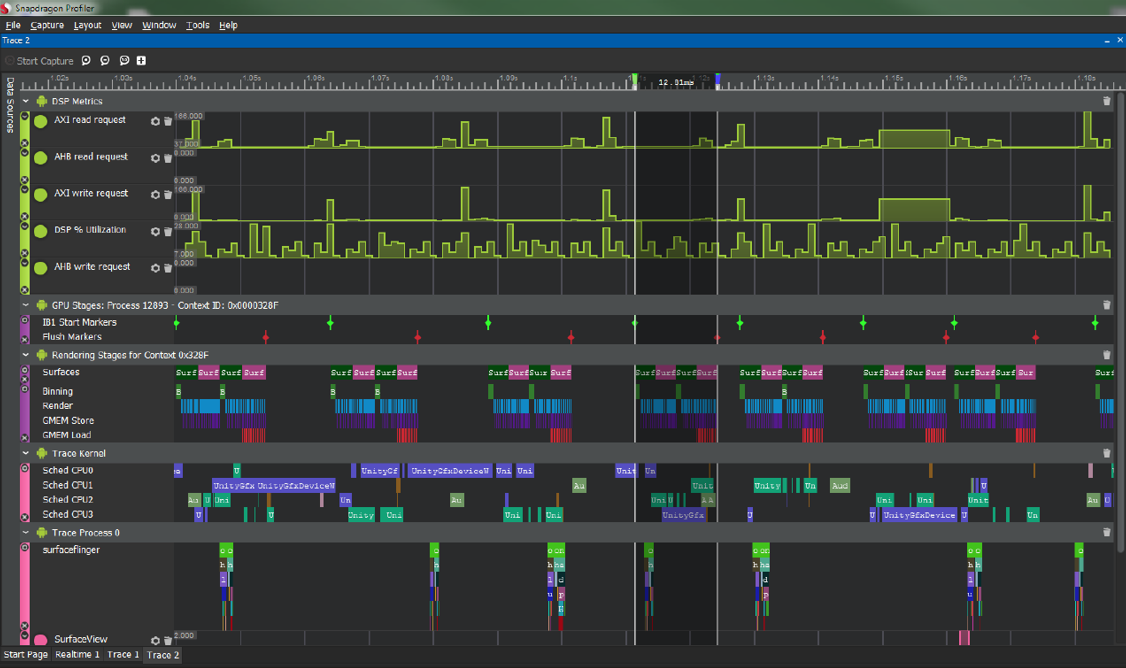
Trace allows for a specific time performance capture to provide a detailed visualization of the system and driver work being performed.
After capture, the user can zoom in, inspect, and measure detailed attributes. Traces can be capture from the following Android components: * OpenGL ES * DSP * Activity Manager * Audio * Camera * CPU * Dalvik VM * Disk I/O * Graphics * Hardware modules * Input * Kernel Workqueues * RenderScript * Resource Loading * Synchronization Manager * Video * View * WebView * Window manager
Snapshot
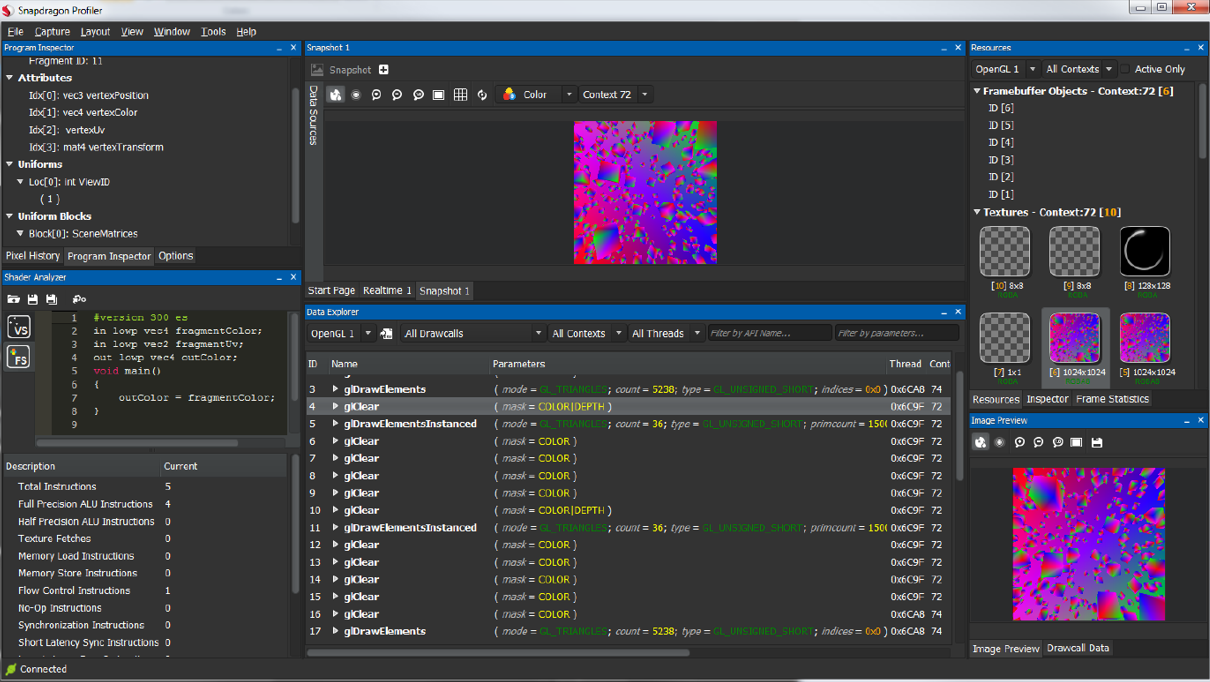
Snapshot mode provides the user with a complete view of a rendered frame. There is a detailed draw call list, resources (framebuffers, textures, shaders), shader complexity analysis, pixel history, overdraw analysis, texture preview, frame statistics, and more.
Vulkan in Snapdragon Profiler
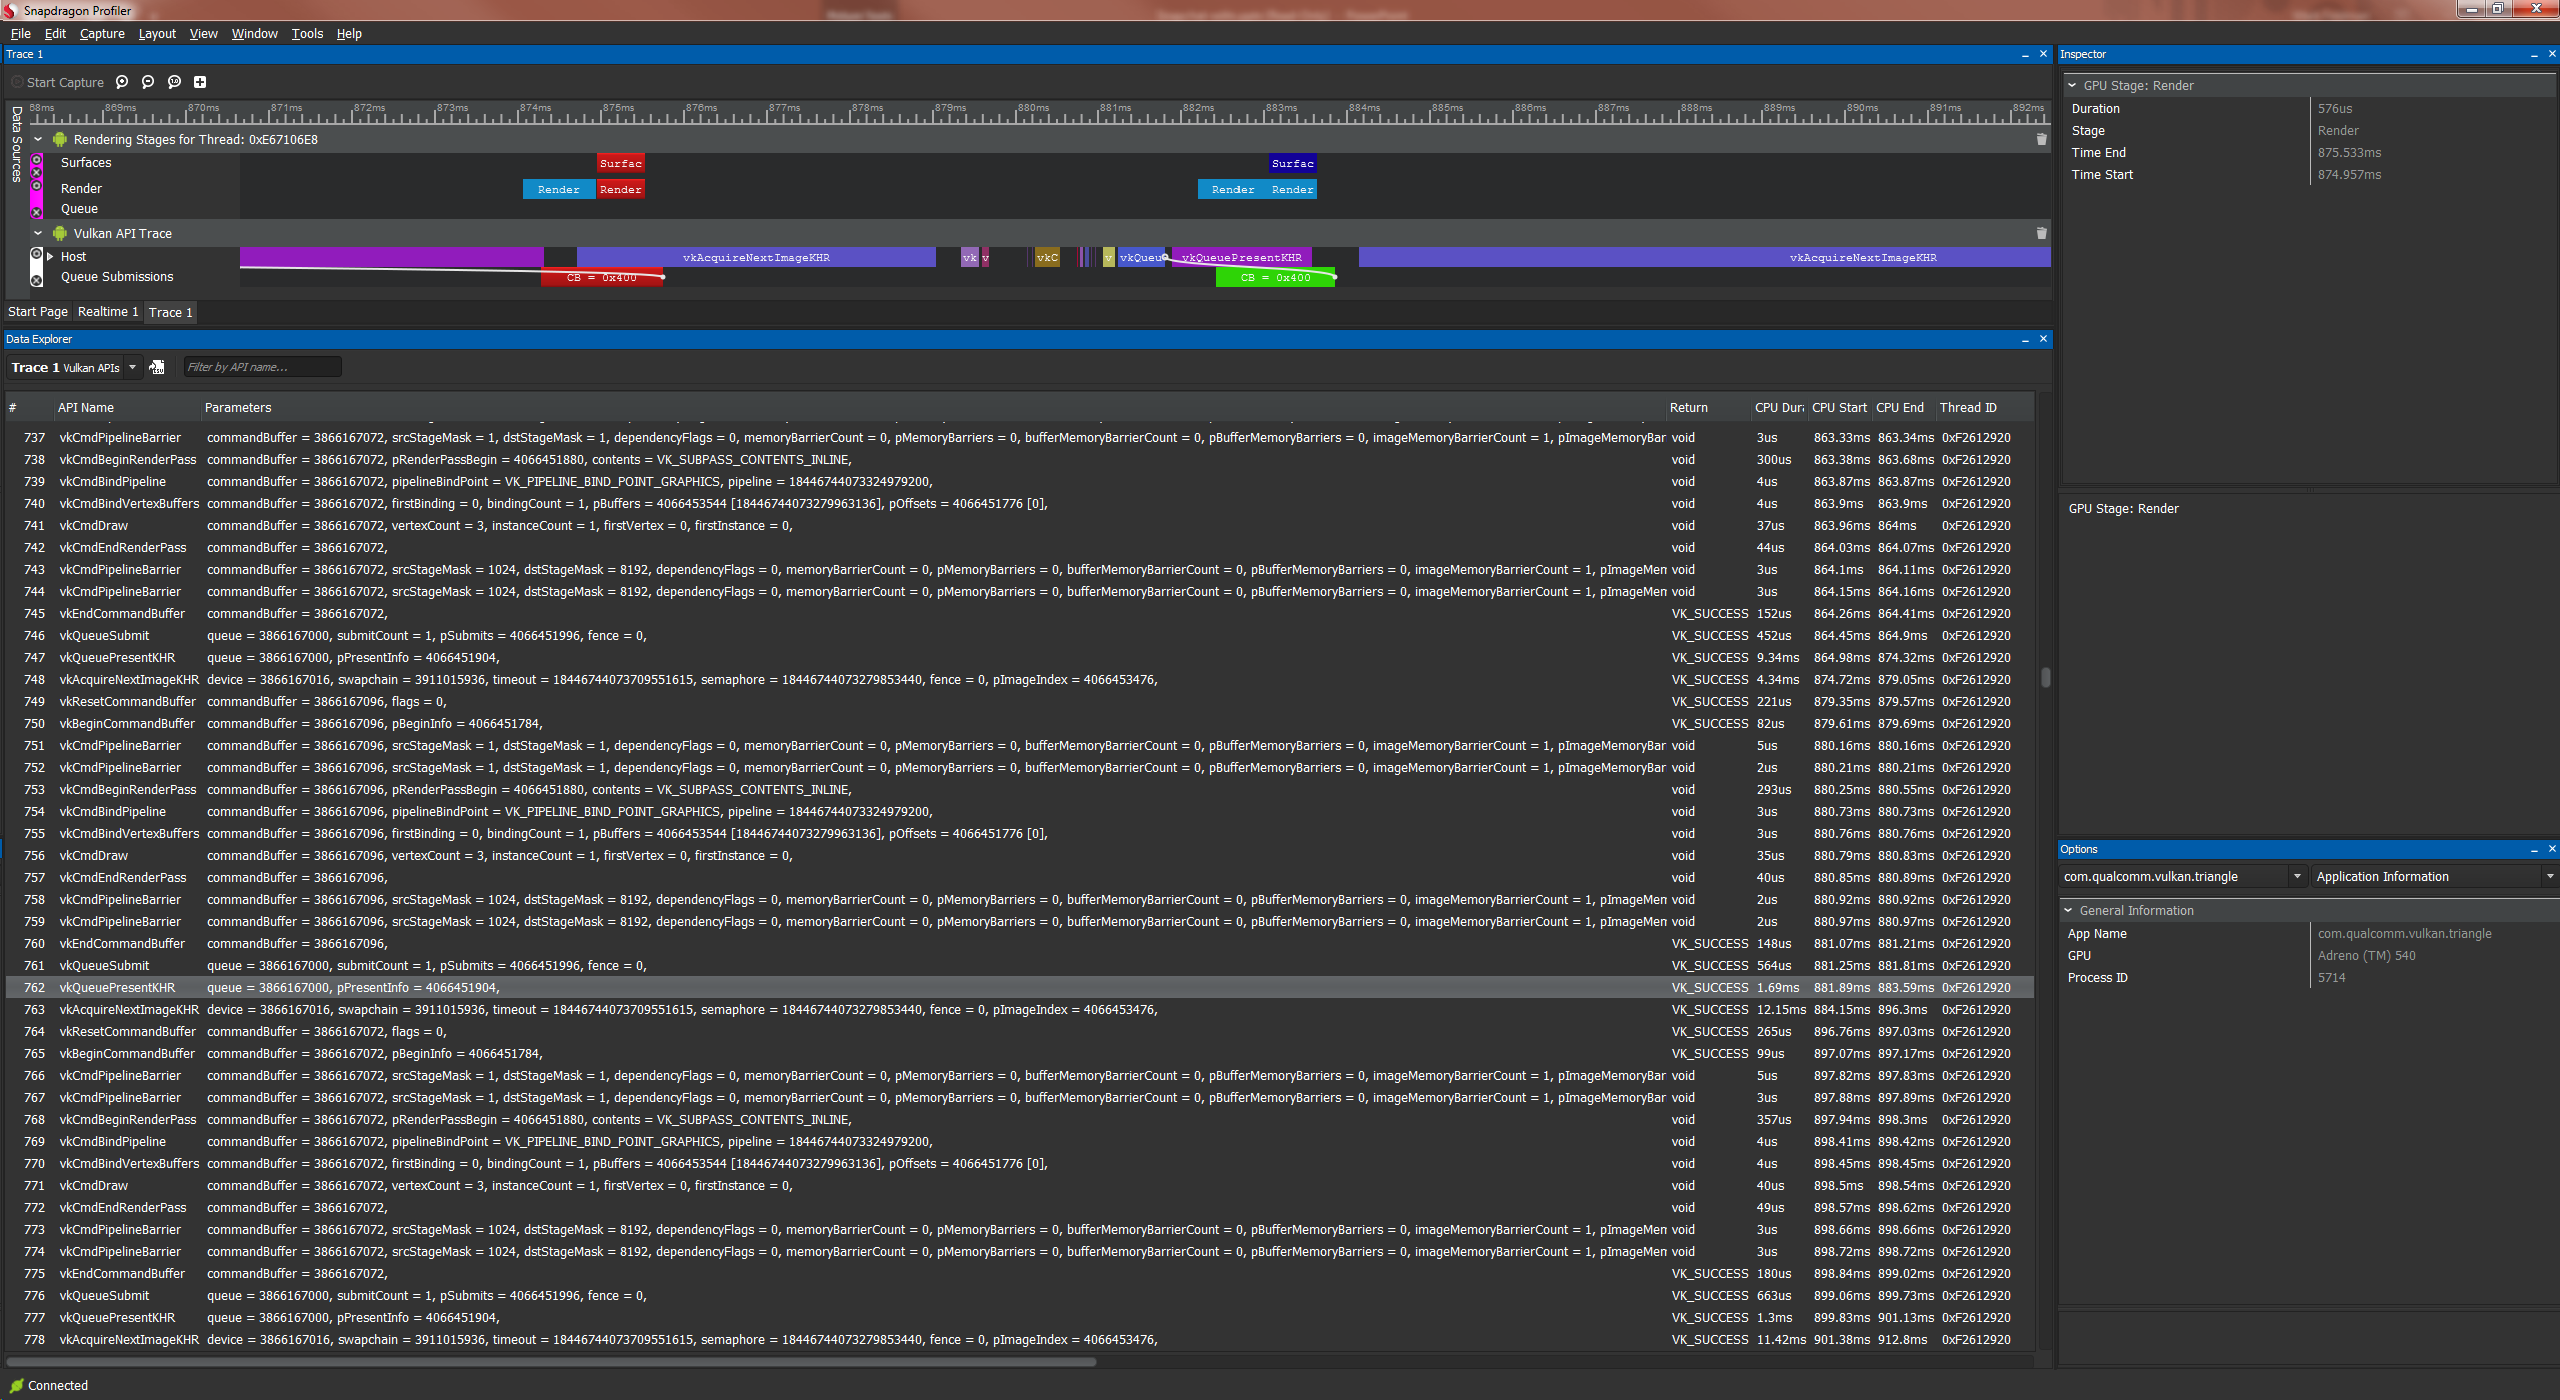
A Vulkan application can be profiled with Snapdragon Profiler to get insights on Vulkan-specific rendering information. The user creates a trace and selects both Vulkan Rendering stages and Vulkan API trace metrics.
After a capture is made, a detailed graph is presented with the surface and rendering stages information, as well as a detailed table containing Vulkan API calls, parameters, and timing information.
You can find out more about Snapdragon Profiler and download a copy from the Qualcomm Developer Network at https://developer.qualcomm.com/software/snapdragon-profiler.