Get Started with Windows on Arm64 Development
Introduction
In the last several years, Arm chips have made the leap from powering consumer cell phones to laptops. Powerful, lightweight, and always connected, Arm presents a new future for personal computing devices that users can take with them anywhere. There are numerous Windows 10 Arm devices on the market from manufacturers such as Microsoft, Lenovo, and Samsung. Users can run 32-bit x86 versions of their favorite programs in emulation, but that comes with performance trade-offs. 64-bit x86-64 programs simply do not run. As the install base grows, there is increasing demand for applications and games that can run natively on this hardware and take advantage of all it has to offer. Developers want software to be available to as many potential users as possible, and for that software to run without compromise. However, additional platforms often carry a significant amount of additional work. This general development guide describes the work and collaboration between Microsoft and Qualcomm® to make porting software to Windows 10 on Arm as streamlined as possible. The following sections walk users through these processes and features from the comfort of their current x86-64 development environment:
Necessary setup for Visual Studio
Adding Arm64 as a build target to a project
How to enable remote debugging on an Arm device to assess performance and issues on Arm64
Key platform details that set Arm64 apart from x86-64 and x86 systems that will be important to consider during development
Note
This guide assumes existing knowledge and experience with software development, basic familiarity with Visual Studio and associated tools, and an understanding of x86/x86-64 systems. It also assumes that development work will be performed on an x86-64 Windows 10 device. At the time of writing (May 2020), development tools such as Visual Studio and Unreal Engine Editor do not run natively on Arm64 but can build applications and games to Arm64 targets.
Getting started in Visual Studio
This section provides the necessary steps to enable Arm64 Development in Visual Studio. Both Visual Studio 2017 and Visual Studio 2019 are configured similarly. Examples provided in this guide use Visual Studio 2017.
Prerequisites
A 64-bit host development system running Windows 10. This is where you will do your development and the bulk of debugging.
A target system running Windows 10 Arm64. This is where you will ultimately run and test software.
Installing and configuring Visual Studio on the Development Host
Run the latest version of Visual Studio Installer.
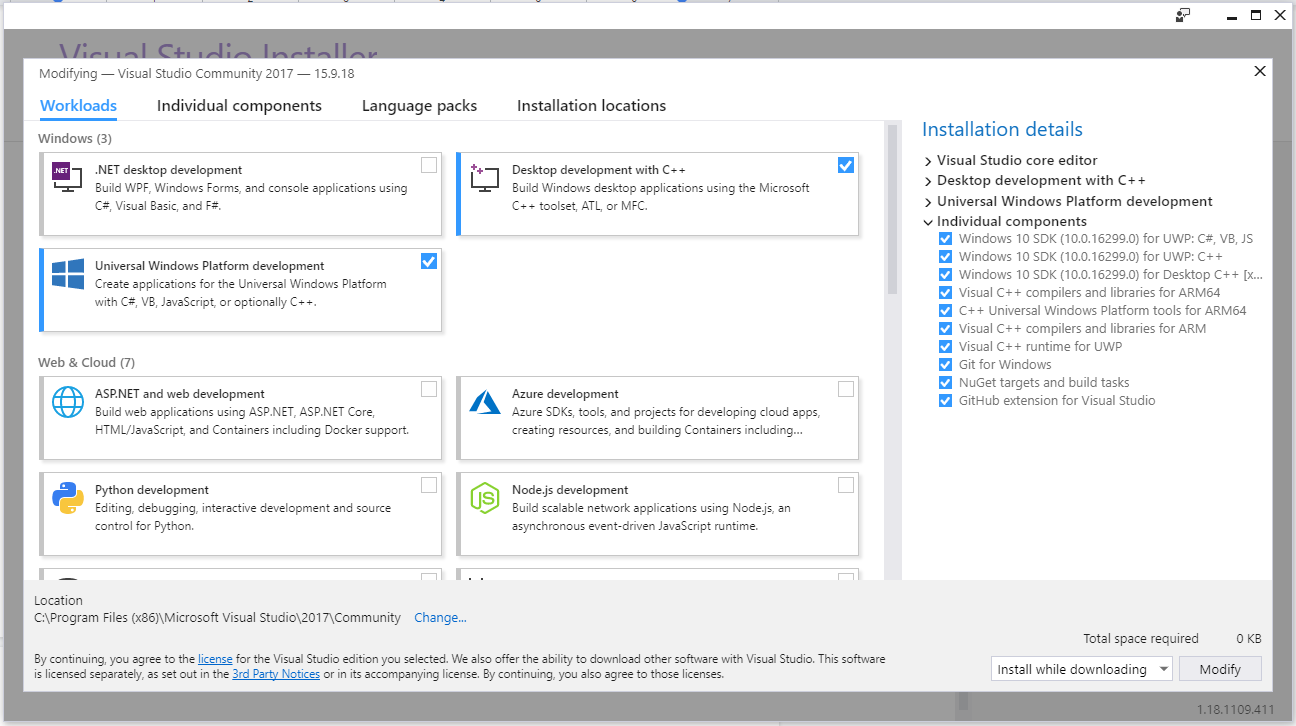
Install Visual Studio with the following workloads:
Desktop Development with C++
Universal Windows Platform Development
Game development with C++ (for game development only)
Install the following individual components:
Visual C++ compilers and libraries for Arm
Visual C++ compilers and libraries for Arm64
Visual C++ runtime for UWP
C++ Universal Windows Platform tools for Arm64
Windows 10 SDK (v10.0.18362 or newer)
Installing and configuring the Arm64 target device
Note
Ensure that the latest Windows updates are installed before configuring the Arm64 target device.
Download the Windows 10 SDK (v10.0.18362 or newer) from: https://developer.microsoft.com/en-us/windows/downloads/windows-10-sdk/
During installation, select Debugging Tools for Windows.
Add the Arm64 platform to Visual Studio projects:
In Visual Studio, click Build > Open Configuration Manager.
In the Active Solution Platform list, select <New…>.
In the New Solution Platform dialog box, select the following values:
– Type or select the new platform list: Arm64 – Copy settings from list: x64
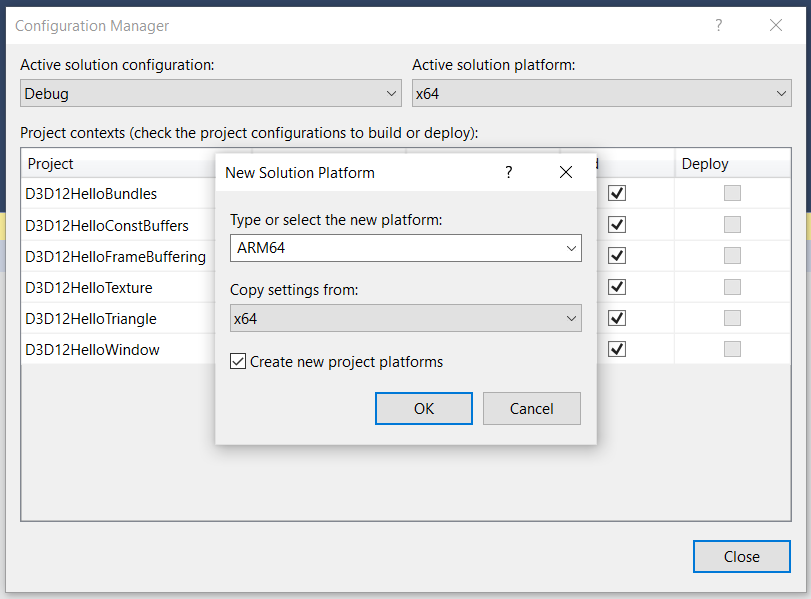
Click OK.
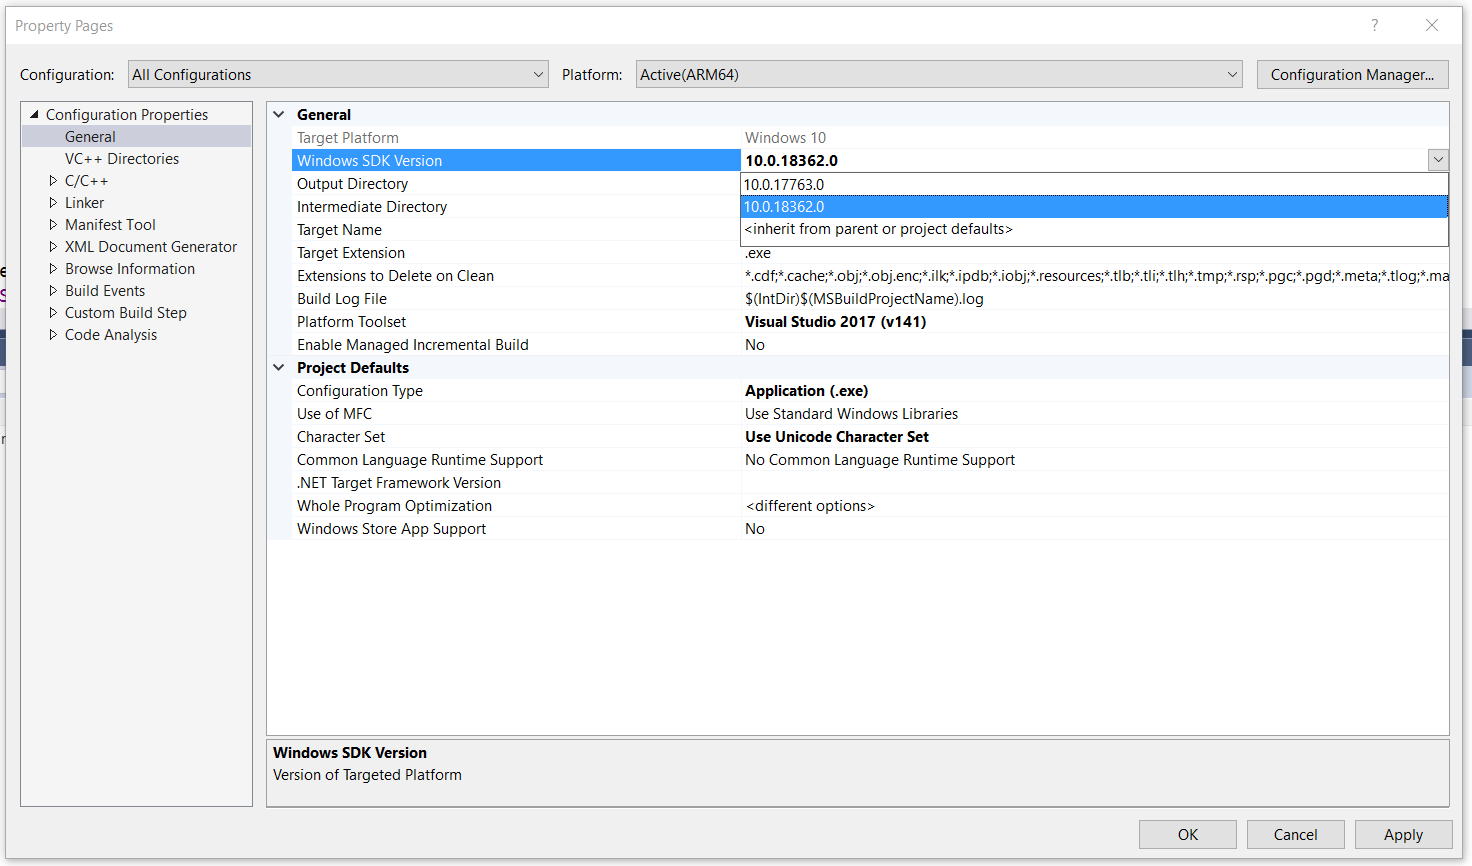
Open the Property Pages of the project by either right-clicking the project in the Solution Explorer window, or from the View menu.
Update the Windows SDK version to 10.0.18362.0 or newer.
Debugging
On-device and remote debugging are both valid options for debugging an application. This guide focuses on remote debugging so that users can continue to work from the comfort of their development environment.
For more information about on-device debugging on Windows 10 Arm64, refer to: https://docs.microsoft.com/en-us/windows-hardware/drivers/debugger/debugging-arm64
If you want to give on-device debugging a try, Microsoft has written a general starting guide to debugging on Windows 10 Arm 64.
Remote debugging with Visual Studio
Remote debugging allows users to debug their application directly from Visual Studio on their development host machine. This allows users easy access to their favorite tools even if they do not have native Arm64 equivalents.
Prerequisites
Ensure that the Development Host and Arm64 target device are on the same network (Domain, Private, or Public).
Setup
Download and install the Arm64 or x64 version of Remote Tools:
Open Remote Debugger. If you do not have administrator privileges on the target device, right-click Remote Debugger and select Run as Administrator.
On the first run, perform the following in the Remote Debugging Configuration dialog box:
Select at least one network type to use with Remote Tools
– Install the Windows Web Services API (if not already installed)
Click Configure remote debugging to set the appropriate firewall rules and start the remote debugger.
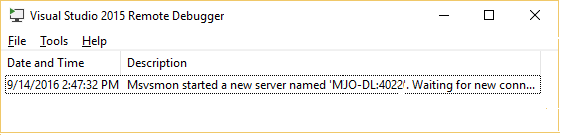
Configuration is complete when the Remote Debugger window appears. The target device will be ready and listening for a connection.
Note
The server name and port number (MJO-DL:4022) are needed to connect from Visual Studio on the development machine.
Connecting to Remote Debugger from Visual Studio
Once the Remote Debugger is running on the Arm64 device, users can connect to it directly from Visual Studio on the x86-64 Development machine.
Launch the Visual Studio project.
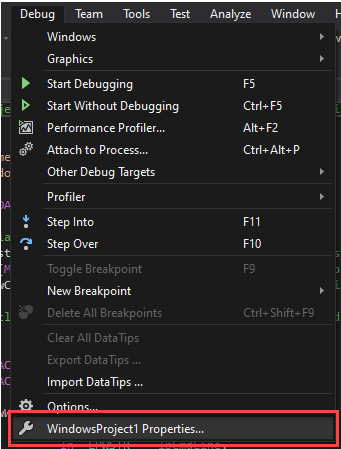
Click Debug and select <Project Name> Properties.
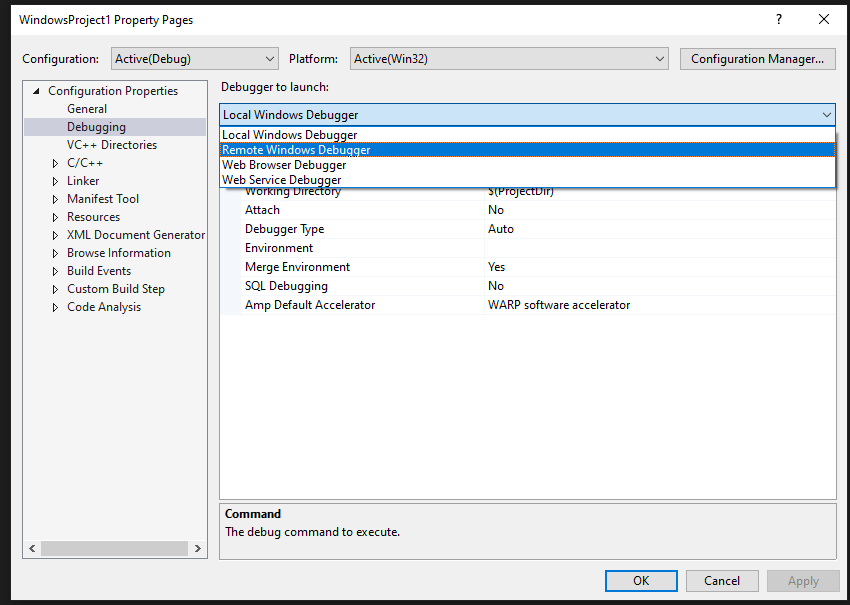
From the Configuration Properties list, select Debugging.
From the Debugger to launch list, select Remote Windows Debugger.
In the Remote Server Name field, enter the server name from the Remote Debugger on the Arm64 device.
Click OK.
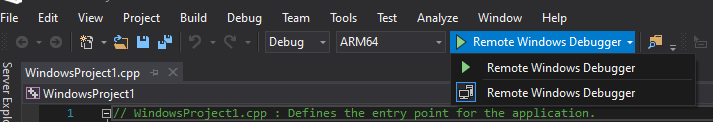
Launch the application in debug directly to the remote device by changing the target at the top of the Visual Studio window.
Distributing the application
Applications compiled by Visual Studio depend on the libraries of the Visual Studio runtime. These libraries were installed on the Arm64 development target when the Windows 10 SDK and the remote debugging tools were installed.
When distributing an application, users must ensure that the installer, or the distribution platform being used, is installing the Visual Studio redistributables.
The installers are available to download from Microsoft: https://support.microsoft.com/en-us/help/2977003/the-latest-supported-visual-c-downloads
Non-redistributable debug runtime
To run, or remotely debug Arm64 executables compiled in the Debug configuration, the debug version of the runtime libraries must be installed on the Arm64 system. These libraries are not provided by the Visual Studio runtime redistributable (see Distributing the application).
The libraries are located in the Debug_NonRedist folder of the Visual Studio installation (Program Files (x86)Microsoft Visual Studio).
This process also requires the debug version of universal C runtime from the Windows SDK, ucrtbased.dll (C:Program Files (x86)Windows Kits10bin<version>arm64ucrt).
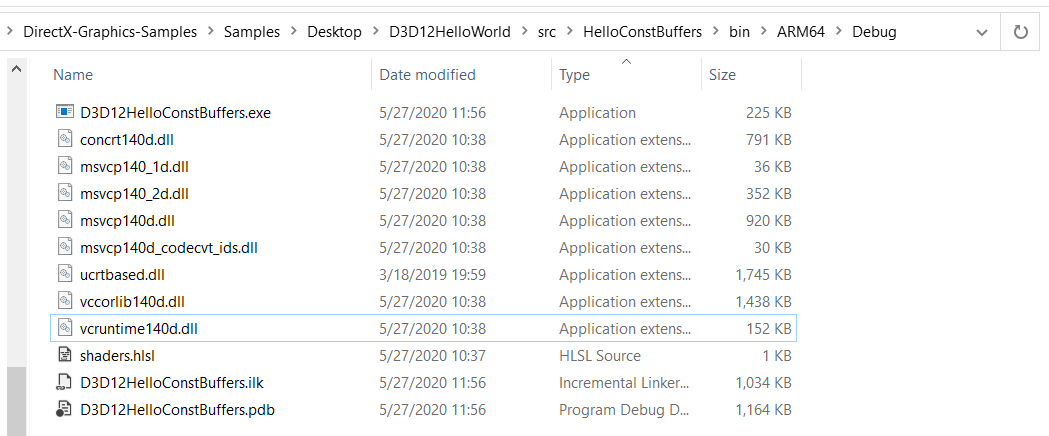
The image below shows a DirectX12 sample built for Arm64 in Debug configuration and its dependent debug libraries.
Visual Studio Performance Profiler
To use the Visual Studio Performance Profiler attached to a remote process on the Arm64 target:
Click Debug > Performance Profiler.
Click the CPU Usage tab and select Record CPU Profile.
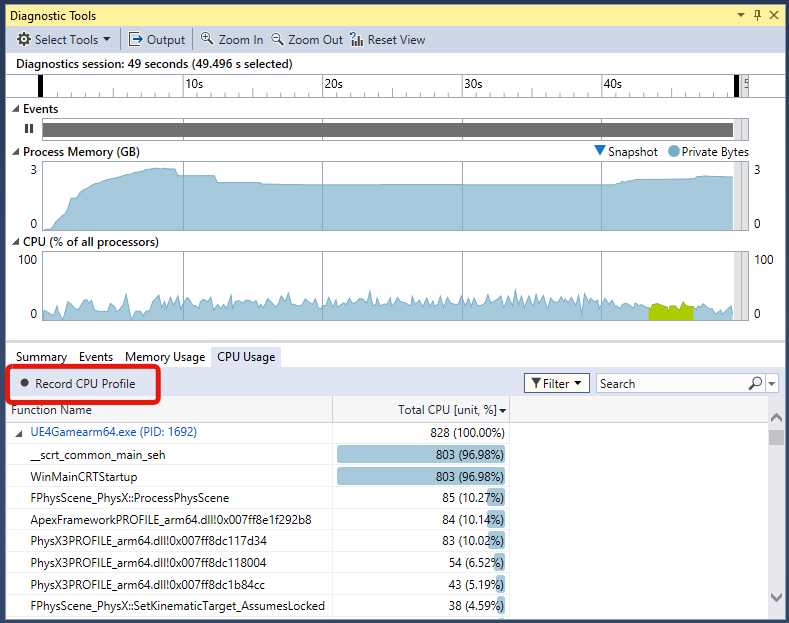
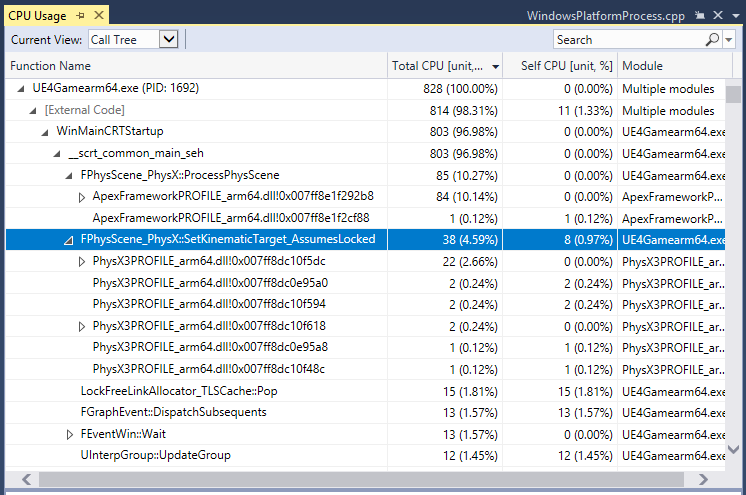
In the Current View list, select Caller/Callee or Call Tree with timing data.
CPU and GPU profiling with PIX
A CPU/GPU profiler is crucial for gave development because it helps identify any potential bottlenecks a game may encounter on-system.
PIX is Microsoft’s CPU and GPU debugger/profiler for DirectX 12 games on Windows and was recently updated to support remote profiling on Arm64 devices.
For tutorials and articles covering advanced PIX usage, refer to Microsoft’s PIX on Windows.
DirectX 12
The Arm64 hardware platform and drivers are optimized for DirectX 12. To ensure the best performance and reliability in a game, use a DirectX 12 render path over DirectX 11 wherever possible.
Setup on Development machine
Install the latest version of PIX (https://devblogs.microsoft.com/pix/download/).
Setup on Arm64 target device
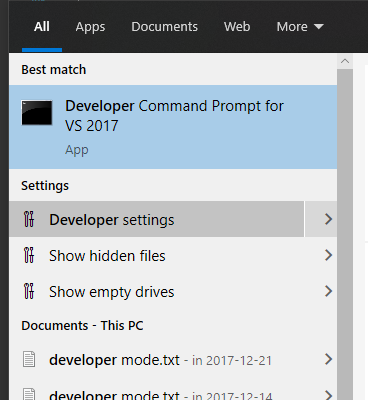
Enable Developer Mode on the device:
Open the Start menu. Search for and select Developer Settings.
Under the Use developer features group, click Developer mode.
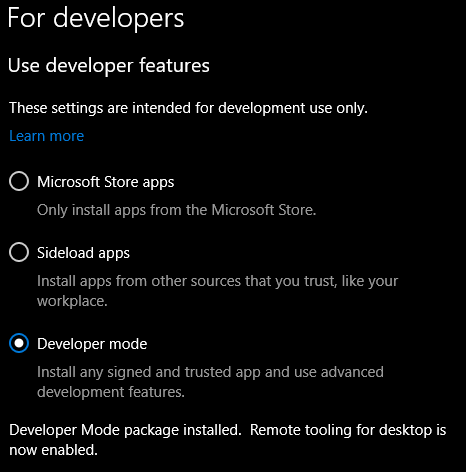
Installation is complete when “Developer Mode package installed” appears.
Copy the entire contents of the latest installed version of PIX from the Development machine (i.e., C:Program FilesMicrosoft PIX<pix version>) to the Arm64 Target Device.
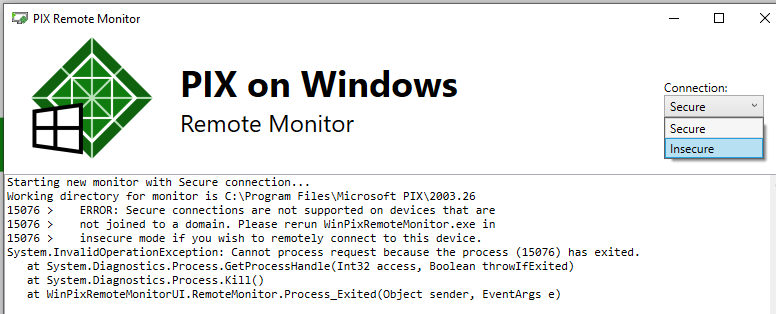
Right-click WinPixRemoteMonitorUI.exe and select Run as Administrator.
[If you are not connected to a domain ONLY] From the Connection list, select Insecure.
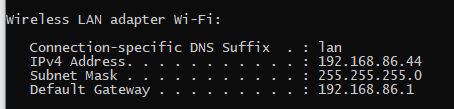
Find the IP Address of the Arm64 Target Device.
Open a command prompt.
Enter “ipconfig” and press Enter.
Find the entry for the current active network connection (wired or wireless) and note the IPv4 address.
Connecting to a remote PIX debugger
After setup is complete on both machines:
Open PIX on the Development machine.
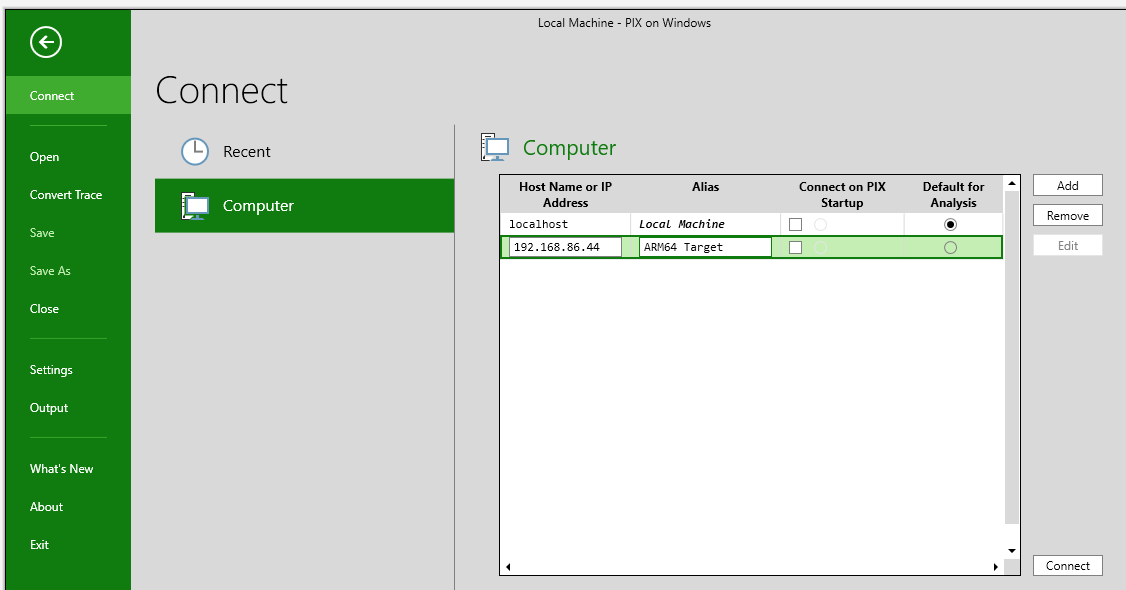
Click the Home tab, then Connect > Computer > Add.
Enter the IP address noted when setting up PIX on the Arm64 device (see step 3c of section Setup on Arm64 target device) in the Host Name or IP Address field.
Enter a name for the connection in the Alias field.
Click Connect.
From PIX on the Development machine, users can launch an executable directly on the Arm64 Target Device, or attach to a current, running application to begin profiling and debugging a game.
A common path would be to launch a game for remote debugging from Visual Studio to the Arm64 Target Device. PIX then connects to the game and selects the debug game’s current, running process.
For more information about PIX, refer to Microsoft’s tool documentation: https://devblogs.microsoft.com/pix/documentation/
Examples
Launching for GPU capture on the Arm64 target
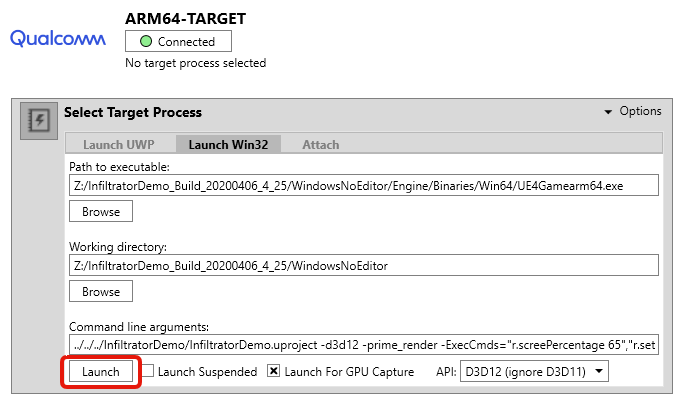
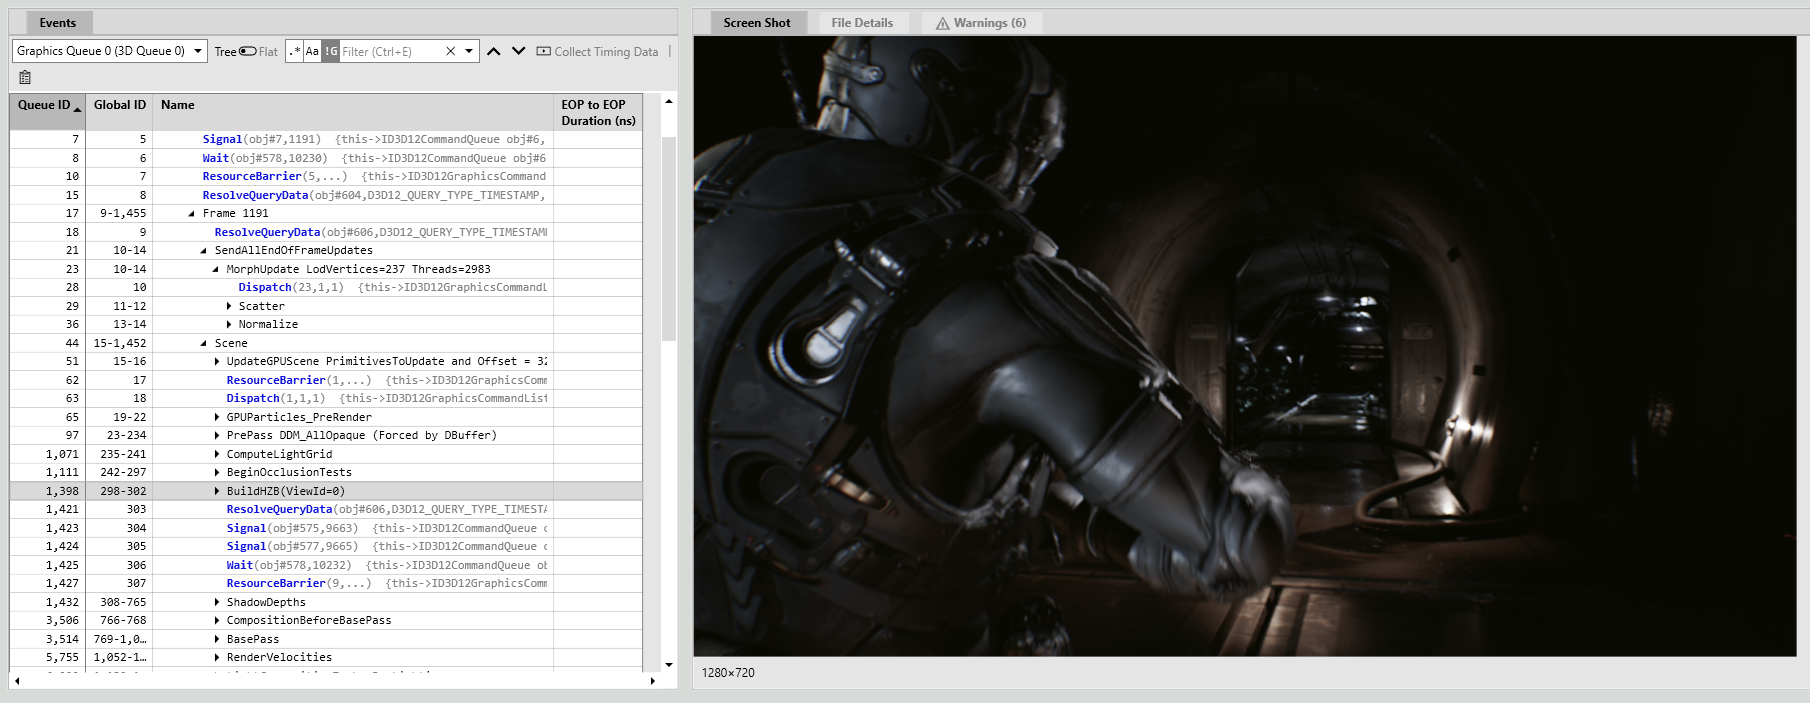
GPU capture (Unreal Engine 4.25 for Arm64)
In this example, the engine inserts PIX events in the GPU command stream with the help of the WinPixEventRuntime library. This helps trace frame render operations.
Launching for CPU capture
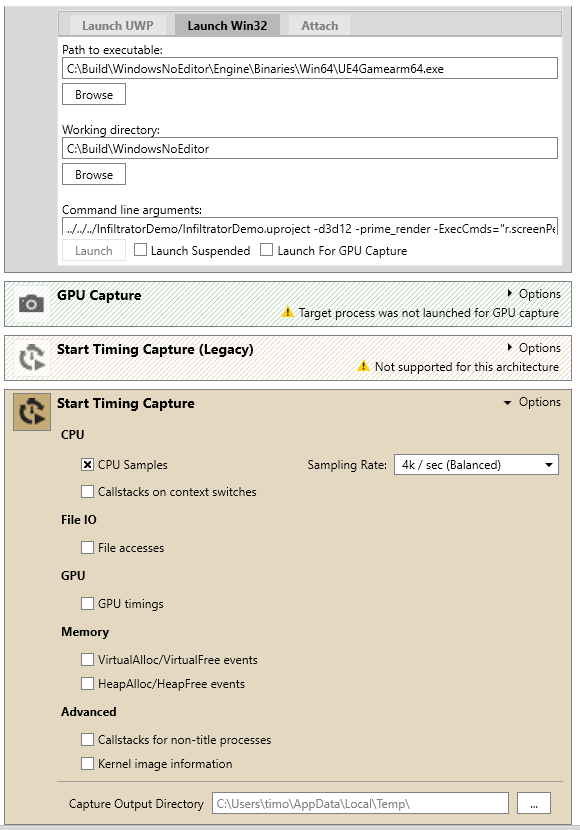
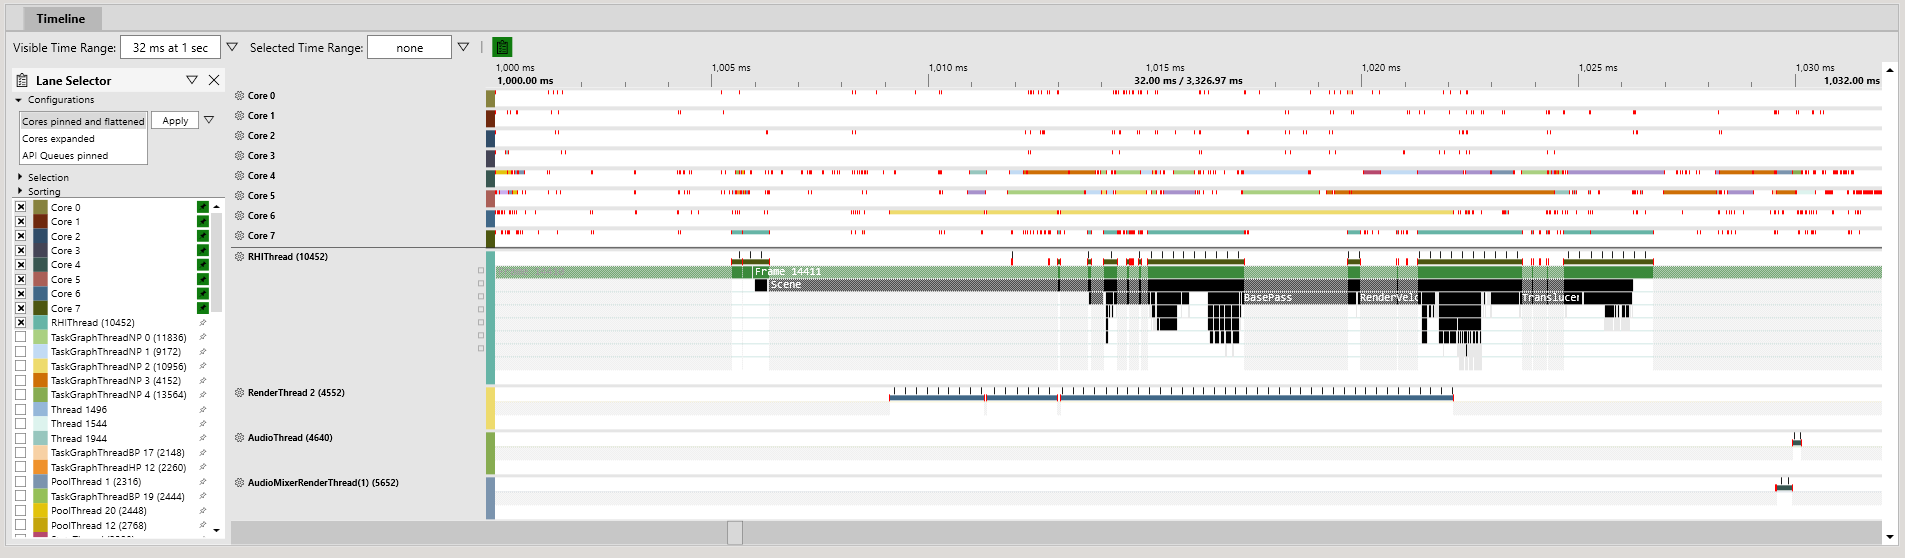
CPU capture
This example shows a CPU capture for a single render frame of UE4 4.25. PIX events are reported for both CPU and GPU captures. Cores utilization 4 through 7 are the faster Gold cores.
Troubleshooting PIX
If the computer is not on a Domain, WinPixRemoteMonitorUI.exe provides a warning during startup that it cannot run on a secure connection. To proceed, switch the Connection mode to Insecure in the UI.
If GPU analysis is not working, ensure that you are running WinPixRemoteMonitorUI.exe as an Administrator.
Platform details
Snapdragon 8cx
The Snapdragon 8cx SoC has the following components:
Four Silver Kryo 495 Cortex-A76 Armv8.2-A cores (1.80 GHz)
Four Gold Kryo 495 Cortex-A76 Armv8.2-A cores (2.84 GHz)
Adreno 680 GPU (1842.5 GFLOPs)
8-channel low power DDR SDRAM at 2133 MHz (68.26 GB/s)
The Gold cores offer higher performance, while the Silver cores have better thermal and power characteristics. The variation in performance between these cores are because of frequency and architectural differences.
When porting high performance applications to 8cx, it is essential to configure thread affinity between the Gold and Silver cores to balance performance and power consumption.
For more details on this heterogeneous processing architecture, see Arm big.LITTLE.
Memory model
The Armv8 architecture employs a weakly-ordered memory model. To optimize performance, reads and writes to central memory may happen in a different order than stated by program instructions.
Other architectures, such as amd64 also use weakly-ordered memory. If you are using high-level threading APIs, these problems are handled for you. However, users who are porting their own implementation of low-level multithreaded code must use the appropriate memory barriers and other configuration for the hardware platform.
For more information, refer to the Memory Ordering chapter of the Programmer’s Guide for Armv8-A.
Neon SIMD
If your software uses SIMD for parallel data processing, the SSE code must be ported over to the Neon instruction set. For more information, refer to the Neon Programmer’s Guide for Armv8-A.
Visual Studio supports Neon intrinsics. New Neon code can be written in parallel with existing SSE code and enabled at compile time for porting. It is also worth noting that the Arm Compute Library is available, and provides Neon-optimized implementation of commonly used algorithms.
Visual Studio also supports the auto-vectorization of source code. This is controlled by the /arch option.
Key differences between Adreno and Desktop GPUs
Adreno 680 in the Qualcomm® Snapdragon™ 8cx Compute Platform is a tile-based GPU optimized to deliver high performance with low power consumption.
Tiled-based rendering is a render pipeline architecture that splits the screen into several tiles and renders each tile in succession. Compared to the direct rendering model favored by older desktop GPU technology, this greatly reduces memory bandwidth, which reduces power consumption and improves performance.
While this technology was pioneered on mobile devices, modern and discrete desktop GPUs from major vendors all use tiled rendering as well.
If you are porting from an older, rendering architecture, ensure that the rendering pipeline is optimized for a tiled renderer. Using a deferred renderer and reducing shader counts will yield the best performance improvements when moving from an immediate mode GPU to a tiled GPU.
The Adreno 680 also benefits from the unified memory architecture of the Snapdragon 8cx SoC. Compared to discrete desktop GPUs, there is no distinction between operating system memory and GPU memory, which allows the following: - Better use of resources depending on CPU or GPU intensive tasks - No transfers between central and GPU memory - Less overall power consumption
For more details, refer to the various sections of the developer guides.
References
Qualcomm Technologies, Inc.
Snapdragon Developer Tools https://developer.qualcomm.com/solutions/snapdragon-developer-tools
Windows
Windows 10 on Arm documentation https://docs.microsoft.com/en-us/windows/arm/
Platform details
Programmer’s Guide for Armv8-A https://developer.arm.com/docs/den0024/a
Memory Ordering https://developer.arm.com/docs/den0024/a/memory-ordering
Windows on Arm – An assembly language primer https://www.codemachine.com/article_armasm.html