Identify application bottlenecks
How many frames per second?
You may already know that you have a performance problem before you start using Snapdragon Profiler. Even if you do not, it is recommended to examine the app’s current, overall performance to identify bottlenecks.
Frame rate is an ideal place to start. Games usually run best at 30 or 60 frames per second (fps), and sometimes higher for virtual and extended reality (VR/XR) applications.
One aspect of this is the average frame rate, which measures how fast the app runs on average. Another aspect is consistency of the frame rate. Even though your average stays close to your target frame rate, occasional long frames may miss that target. User experience then suffers from stuttering and glitches, and motion is not smooth, so your app would benefit from optimization.
If your app is not optimized, the average frame rate may be lower than your target and the app will not reach its desired performance level. If you have optimized your app, you may be closer to your average but still have periodic spikes in the frame rate. The spikes hamper animation, so you will want to smooth those out by identifying the problems and modifying your code.
In both cases, Snapdragon Profiler can take you straight to the performance level of your app in fps. The screenshot below shows an average (light blue line) of 42.022 fps.
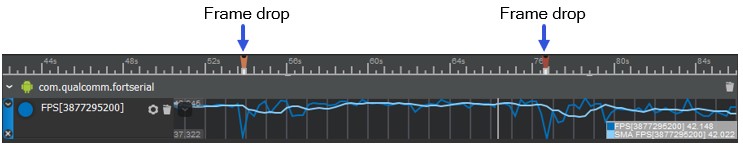
While 42 fps may suffice as an average, the range (blue line) periodically falls as low as 37.322 fps. That suggests that the app is dropping frames, which harms performance.
Note also that applications should choose to hit frame rates that are divisors or multiples of their platform’s Vsync rate. Since a typical platform has a 60Hz Vsync, 30Hz or 60Hz are the only acceptable targets.
Exploring potential bottlenecks
While no single metric can show you where your performance problems lie and how to address them, Snapdragon Profiler lets you examine dozens of metrics to understand how your app is interacting with the hardware.
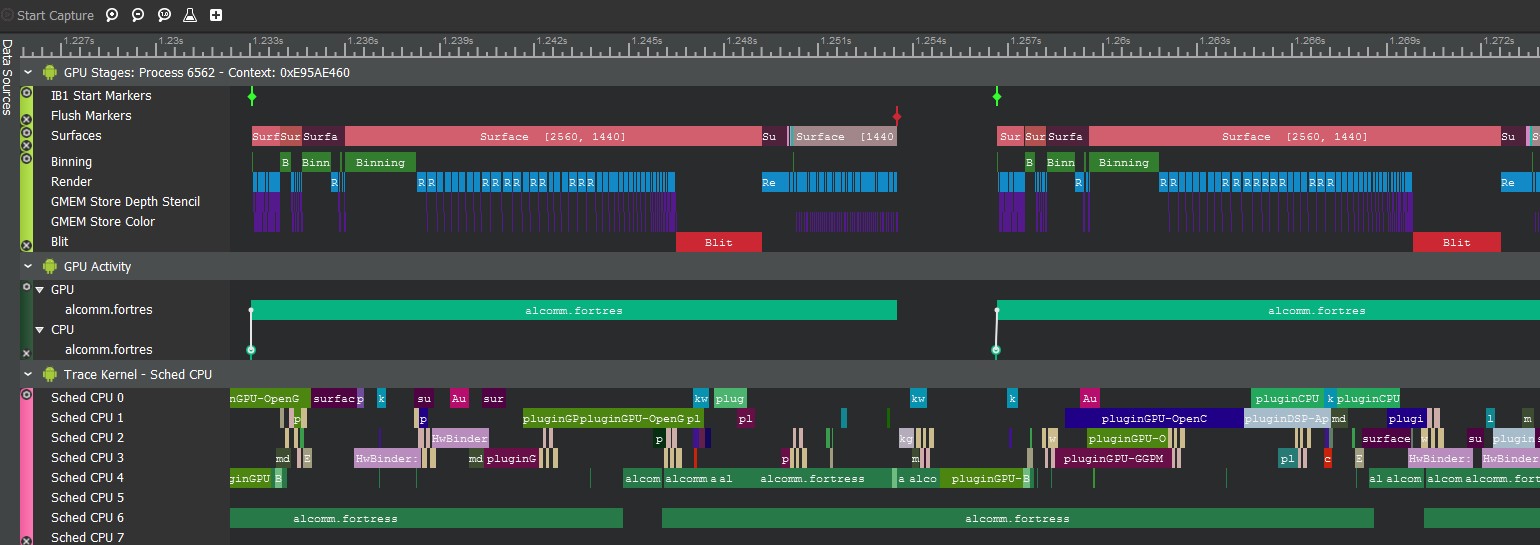
The sections in the Trace Capture mode screenshot correspond to three important metrics to start with:
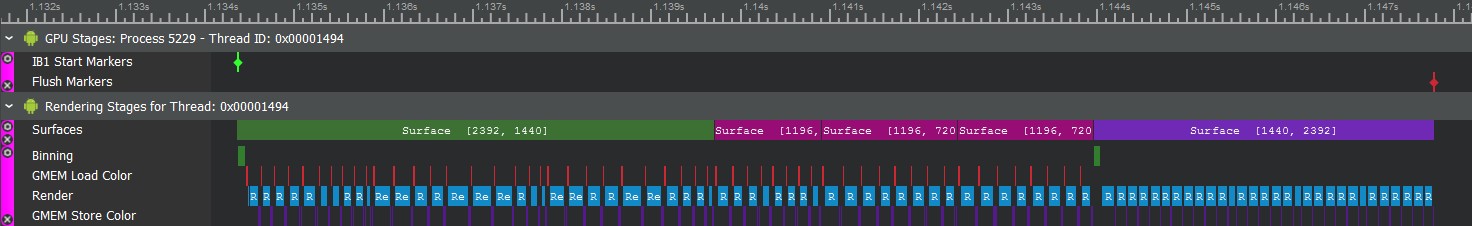
Rendering Stage – Each Rendering Stage in Snapdragon Profiler is a metric that represents the app’s execution on the GPU. Each data track is a subset of the metric, and the number of tracks varies depending on the application. In the following screenshot, the green, magenta, and purple bars show individual surfaces and the tracks under the Surface bars represent related rendering stages.
GPU Activity – A system metric that shows the interaction between the CPU and GPU.
CPU Scheduling (“Trace Kernel - Sched CPU”) – A system metric that provides an overview of the app’s execution on each CPU core. You can see which parts of your app are running where, and whether you have a scheduling or thread contention problem.
These metrics can help you explore three of the main areas where performance may be limited: the GPU, the CPU and Vsync, or the vertical sync refresh on the display.
GPU-bound application
In a graphics-intensive application, it is recommended to start the process of elimination with the GPU.
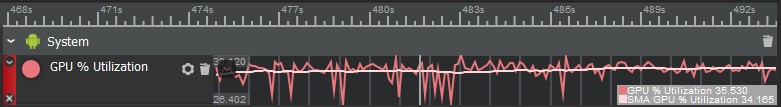
In the Real-Time view of Snapdragon Profiler, GPU % Utilization is a top-level indicator. The screenshot below shows utilization in the range of 26-38%.
Compare that to the following screenshot, showing utilization in the range of 98-100%:
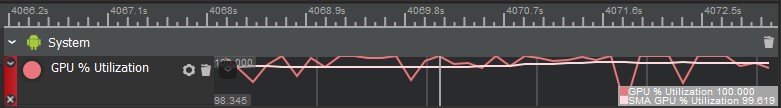
The latter is a strong indication that the app is GPU-bound.
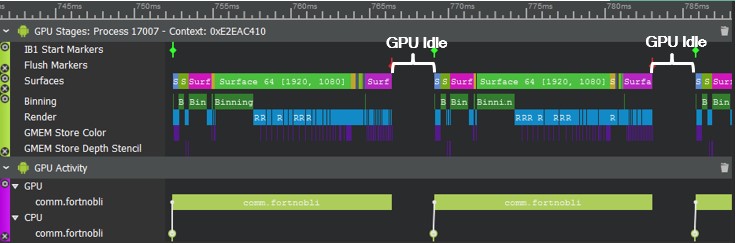
Besides the Real-Time view, Trace Capture mode in Snapdragon Profiler offers another point of reference. If the app is not GPU-bound, gaps in GPU activity are likely to show up.
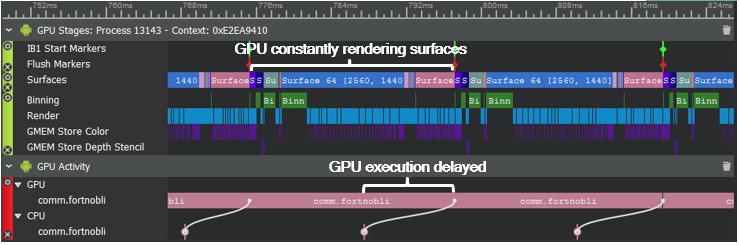
If the app is GPU-bound, then GPU execution might be delayed and the GPU might be constantly rendering surfaces.
CPU-bound app
If the app is not GPU-bound, determine whether the app is CPU-bound or not.
Unlike a GPU-bound app, the CPU % Utilization in the Real-Time view is not a reliable indicator of a CPU-bound app.


Average CPU utilization is 16%in the first app and 23% in the second. The first is CPU-bound, but the difference between them is not as striking as the GPU-bound app above, so the app may appear not to be CPU-bound.
Two strong criteria for a CPU-bound app are that it is not GPU-bound and has an average frame time exceeding 16ms. To determine whether an app is CPU-bound, consider the multi-threaded nature of the app and the CPU. It is also helpful to go beyond CPU % Utilization and examine metrics like frequencies and thread scheduling.
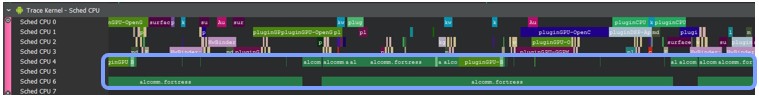
In the Trace Capture mode screenshot below, the thread in Sched CPU 6 appears to bottleneck the CPU:
The next step is to look deeper into that thread to identify hotspots and candidates for multi-threading. The Sampling capture mode periodically samples the CPU program counter at a fixed interval and identifies CPU hot-paths. It offers a statistical representation of activity, including the time spent in each function and library. You can see which functions in your code take the most execution time.
The following capture shows both the functions and the sequence of functions running on the CPU to render cloth textures. The red and orange blocks indicate hotspots in the app code.
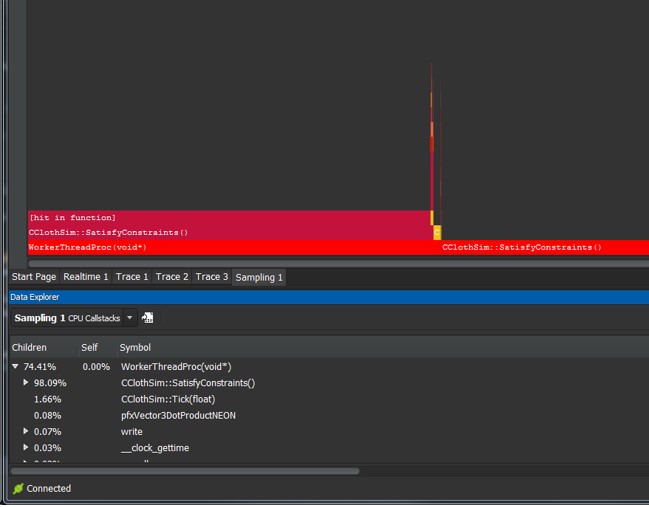
In this case, CPU sampling shows SatisfyConstraints() as the biggest hotspot, with 98% of activity.
To delve even deeper, Snapdragon Profiler supports user markers and the Native Tracing API built into the Android NDK. Android developers can use that API to insert trace markers into the app code and see this data in Snapdragon Profiler.
In the folllowing example, you can use android/trace.h to instrument the SatisfyConstraints() call and trace it back to the main thread, which is a worker function.
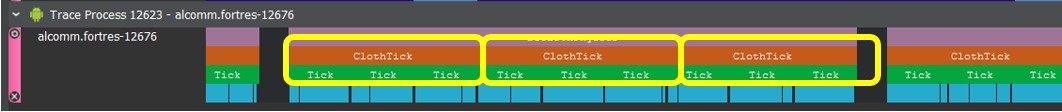
A texture in the rendered frame requires one function per cloth, which ticks as needed for the elapsed time. Once the app code is modified to thread the functions out, Snapdragon Profiler can display the following inclusive, correlated view of all activity at once.
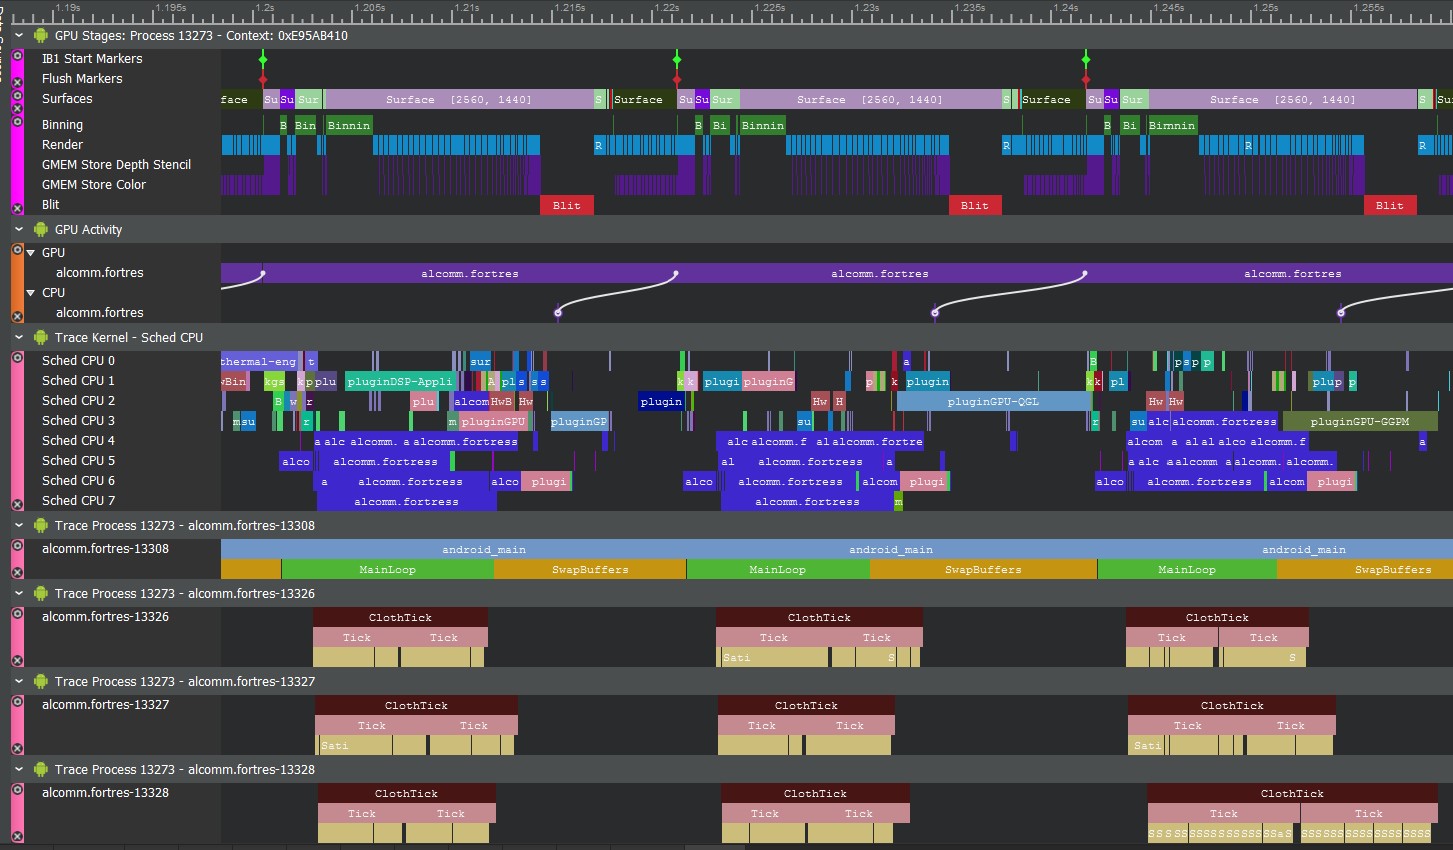
Now, cloth computation is taking place in multiple threads. The output in CPU Scheduling shows more threading. The app is no longer CPU-bound, so the CPU waits for draws to be dispatched.
That process is typical for identifying, diagnosing, and solving a performance problem with Snapdragon Profiler.
Vsync-bound app
If you determine that the app is neither CPU nor GPU-bound, then it may be Vsync-bound, i.e., it may be running as fast as the display hardware can accommodate. Using Trace Capture mode in Snapdragon Profiler, you might see something similar to this:
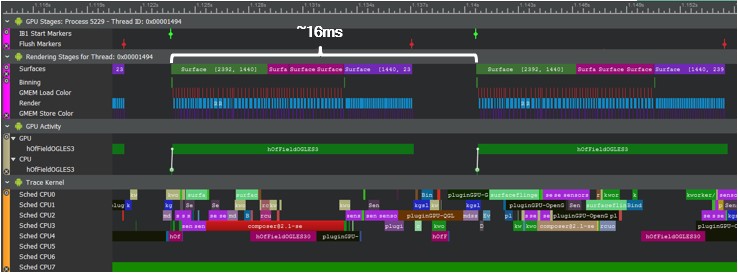
Note that the frame time is right around 16ms (1 second divided by 60 fps) and there is a gap near the end of the frame during which both GPU and CPU are waiting for an available surface to render.
While the goal of many applications is to run as fast as the display will allow, there are still opportunities for optimization even whne an application is Vsync-bound and with benefits beyond a higher frame rate.
Most problems in mobile applications come down to power consumption battery life. Even if your application can meet the target frame rate without binding the CPU and GPU, you may still want to optimize your code. If it can be modified to use less power and run at a lower temperature, the application would meet the target frame rate while doing less work. It might also offer better performance on lower-end devices.