Understanding and resolving Graphics Memory Loads
Certain programming techniques that work well on platforms such as PCs and gaming consoles may not port well to mobile because of different hardware conditions in mobile GPUs.
Graphics Memory (GMEM) Loads are among the most common problems affecting GPU performance in mobile applications. In this section, we show you how to use Snapdragon Profiler to find GMEM Loads in your application code.
In a nutshell
Clear or invalidate all framebuffer attachments. This will indicate to the GPU not to load tile data from system memory into GMEM.
What are Graphics Memory Loads (Unresolves)?
The tiling architecture pipeline of the Qualcomm® Adreno™ GPU includes a render pass. Each tile is rendered into GMEM during the render pass. Following the normal behavior of the driver, previous frame buffer data is loaded from the main memory into GMEM for each tile, i.e., a GMEM Load (or unresolve) occurs.
Why are Graphics Memory Loads expensive?
The problem is that every GMEM Load slows processing. If content of the frame buffer is cleared or invalidated, the driver can clear that tile in GMEM. While that involves an additional graphics call and its associated overhead, it is less expensive than loading the frame buffer back into GMEM for every bin being rendered.
The two main causes of GMEM Loads are:
Improper hints to the driver — The application code makes the driver think that previous content of the frame buffer is needed (usually by neglecting to clear the buffer). That boils down to a relatively easy fix that pays off well in reduced render time. It applies mostly to OpenGL ES programming since Vulkan handles the condition explicitly.
Algorithm — Certain APIs such as glReadPixels and glFlush force pipeline flushes to get results. Doing this mid-frame will cause GMEM Loads when you resuming drawing frame content. You can usually avoid GMEM Loads by modifying the algorithm.
Detecting Graphics Memory Loads in Snapdragon Profiler
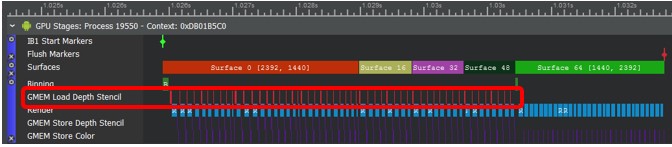
Using Snapdragon Profiler in Trace Capture mode, you can allow the Rendering Stages metric to highlight GMEM Loads in their own track.
In the screenshot below (based on the Depth of Field demo application from the the Adreno SDK), red blocks show that GMEM Loads (Depth Stencil) are taking place as four different surfaces (0, 16, 32 and 48) are rendered:
The Settings dialog for Rendering Stages shows that those GMEM Loads take up about 9% of total rendering time.
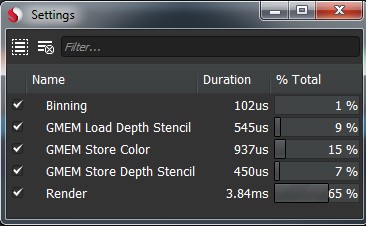
If GMEM Loads are unnecessary, you can reclaim about 9% of frame time.
You can then use Snapshot Capture mode in Snapdragon Profiler to determine the cause of the GMEM Loads.
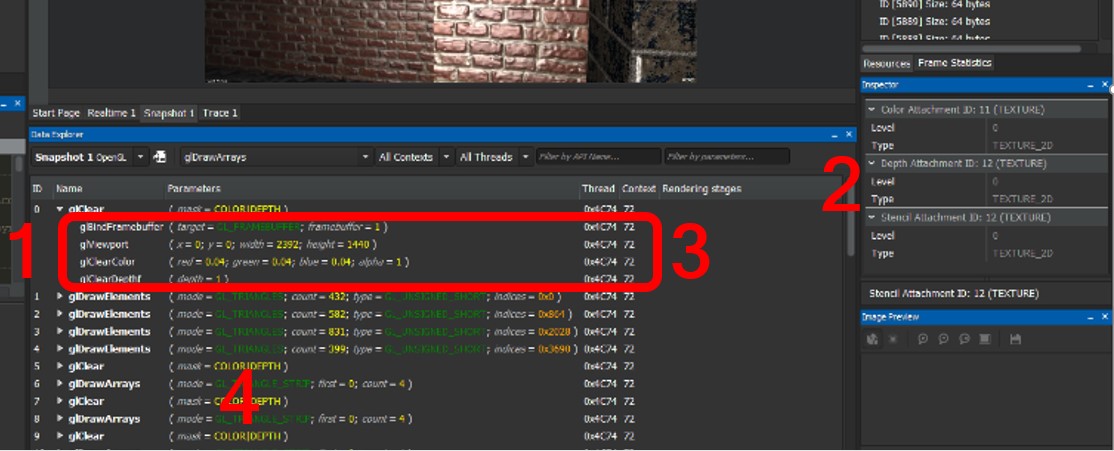
The first surface with GMEM Loads is the first surface bound — glBindFrameBuffer. The framebuffer param is set to 1: # Select frame buffer object 1 (FBO 1) to examine Resources. The Inspector View shows that the surface has attachments for Color, Depth, and Stencil. # The glClearColor and glClearDepth calls leave the GPU thinking that the content of the Stencil attachment is relevant for the next frame. This causes GMEM Loads. Similarly, the other three surfaces (IDs 5, 7 and 9 here) have a Stencil attachment and do not clear it.
After modifying the code to explicitly clear Stencil content from the frame buffer, you can validate the results in Trace Capture mode, which no longer shows the GMEM Load Depth Stencil track:
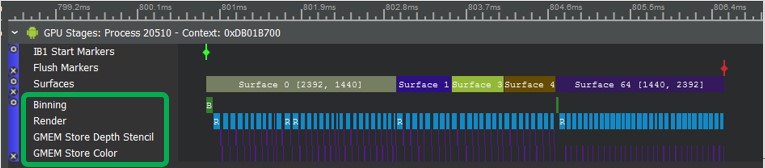
In this case, rendering time is shortened by about 9%.
For more information on GMEM Loads (especially in extended reality apps), see the QDN blog post Profiling VR Apps for Better Performance.